LogiFlow 3D
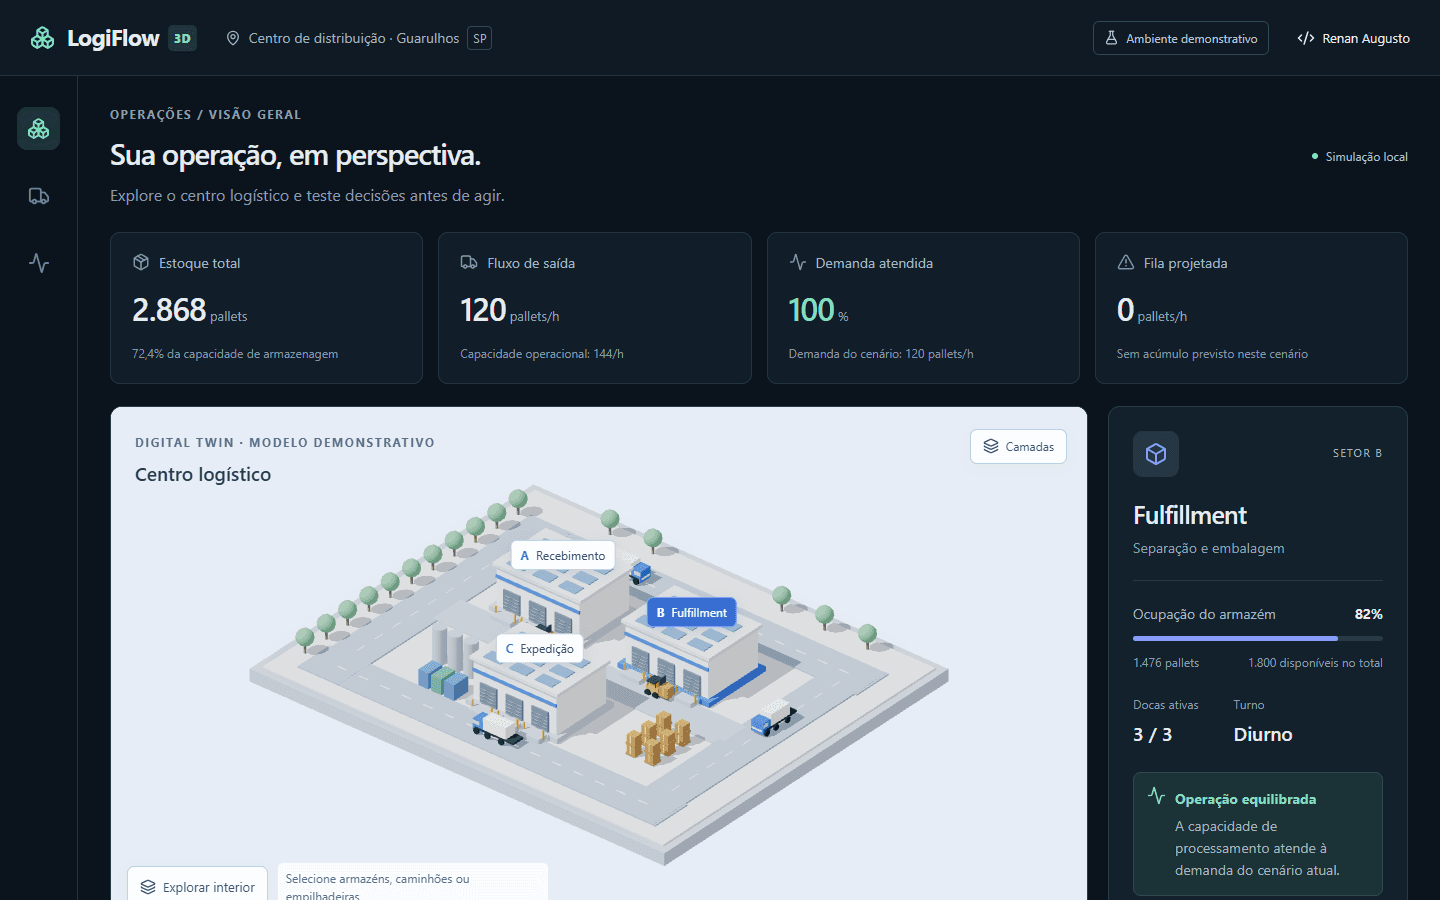
Interactive 3D distribution center for simulating operational decisions, with indicators and comparable scenarios.
Challenge
Isolated spreadsheets don't always show where a bottleneck happens. The idea was to connect a spatial view of a logistics center to indicators and scenarios that can be compared, such as demand peaks and a blocked dock.
Solution
A procedural isometric scene in React Three Fiber with selectable warehouses, docks, trucks and forklifts, shipment tracking across five stages and indicators derived from the same domain functions. Rules live in Clean Architecture-inspired layers with no React dependency.
My contribution
Solo portfolio project: concept, domain modeling, interface, 3D scene, tests and deployment. It is a visual proof of concept, not connected to real facilities.
Outcomes
- Demo published on GitHub Pages with a CI pipeline.
- Keyboard shortcuts, sector selection through accessible HTML buttons and reduced-motion support.
- Fallback for browsers without WebGL.